News
£50bn Transport Overhaul: Inside London's Infrastructure Numbers Game
As major projects reshape the capital's connectivity, the data reveals just how ambitious—and expensive—the vision really is.
3 min read
Updated 2 h ago
News
As major projects reshape the capital's connectivity, the data reveals just how ambitious—and expensive—the vision really is.
3 min read
Updated 2 h ago
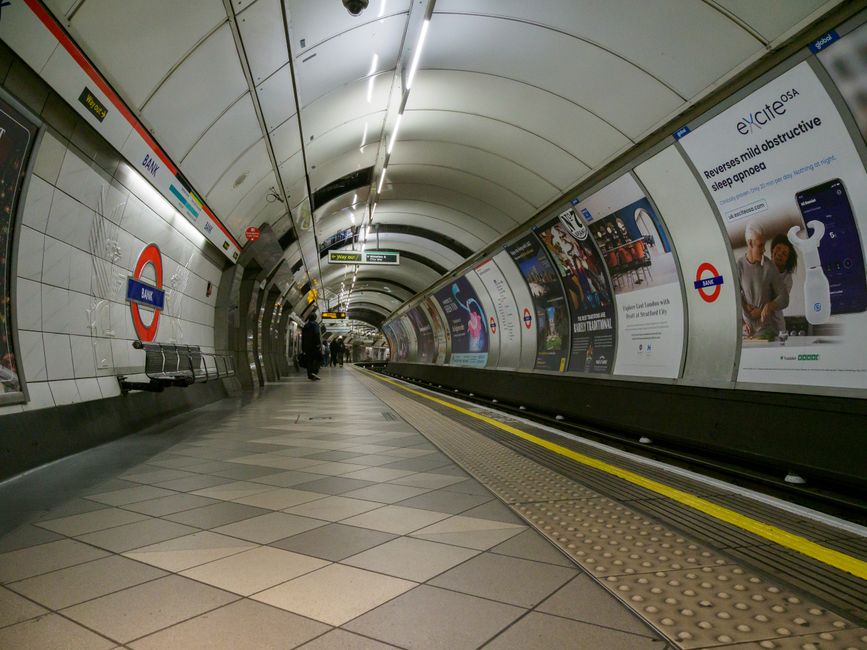
London's transport infrastructure is undergoing its most significant transformation in decades, yet the true scale of the undertaking remains buried in spreadsheets and government reports. The numbers, however, tell a striking story about how the city is investing in its future.
The Elizabeth Line, now fully operational between Reading and Shenfield, represents £19.1bn in capital expenditure—making it one of Europe's most expensive rail projects per kilometre. Yet TfL data shows it's already carrying 600,000 passenger journeys weekly, a figure that exceeds initial projections. The line's impact on outer zones is measurable: property values within 500 metres of Hayes and Harlington station increased by 18 per cent in the two years following completion, according to Savills analysis.
Meanwhile, the Northern Line Extension into Battersea and Nine Elms consumed £2.4bn for just 3.2 kilometres of track—approximately £750m per kilometre, highlighting the extraordinary costs of deep-tunnel construction beneath London's congested streets. The project's delay from 2020 to 2021 cost an additional £80m in overruns.
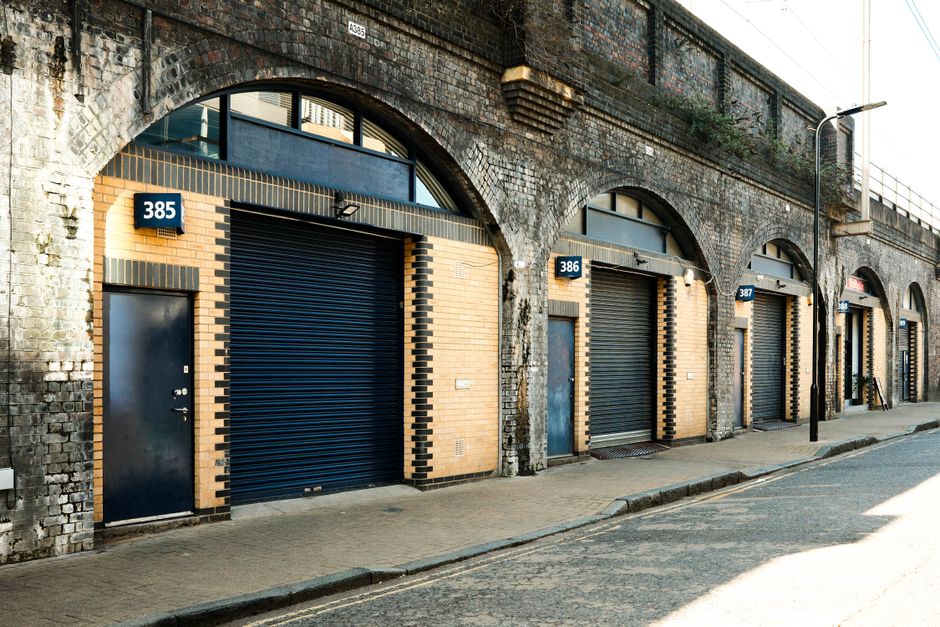
Bus rapid transit schemes are presenting a more cost-effective alternative. The proposed South London Transit corridor, stretching 28km from Wimbledon through Streatham to Croydon, carries an estimated £1.2bn price tag—roughly £43m per kilometre. Transport planners project it will serve 45,000 daily journeys within a decade.
Beyond rail, cycling infrastructure data is compelling TfL's budget calculations. The Central London Grid—encompassing protected cycle routes across Westminster, City of London, and Tower Hamlets—required £180m investment but has generated a 67 per cent increase in cycling volumes since 2019, according to automatic counters at key junctions. Elsewhere, the Barclays Cycle Hire scheme now operates 12,000 bikes across 800 docking stations, processing 15 million journeys annually.
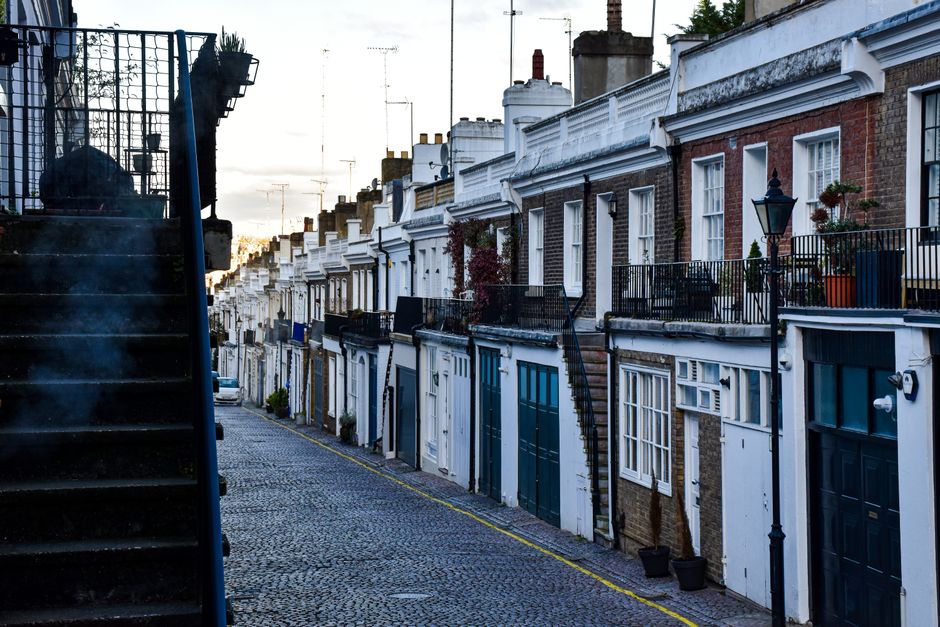
Road maintenance figures underscore deferred spending challenges. Westminster Council's pathole backlog stands at approximately 8,000 reported defects, with average repair costs at £2,100 per location—suggesting a £16.8m liability. Across Greater London, similar maintenance backlogs total an estimated £2.7bn, according to the Local Government Association.
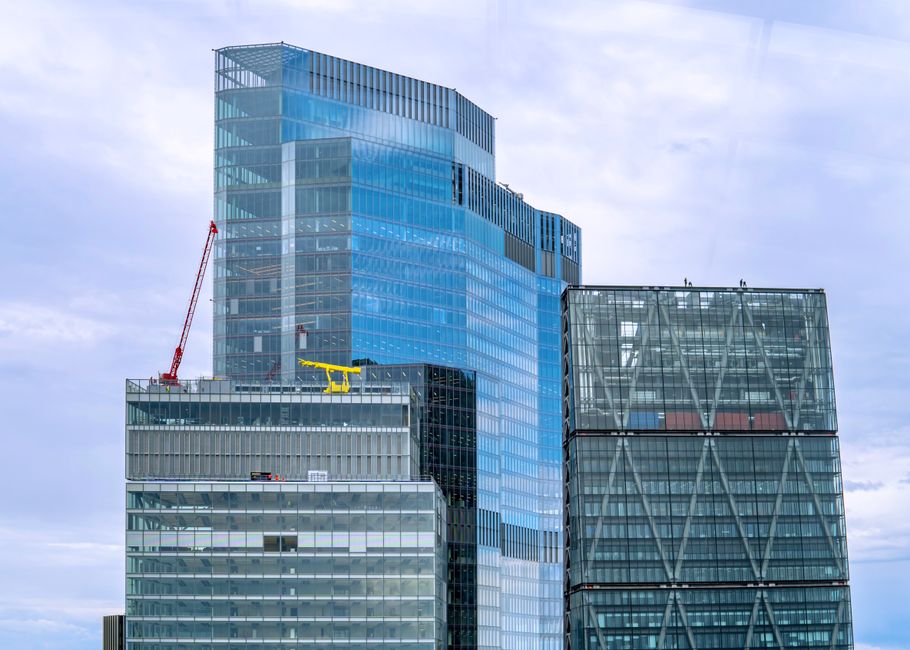
Climate investments are reshaping the numbers too. The capital's net-zero transport targets require a projected £8bn investment through 2030 in bus fleet electrification, charging infrastructure, and pedestrian accessibility upgrades. Currently, 44 per cent of London's bus fleet is electric or hydrogen-powered, up from 12 per cent in 2020.
These figures reveal a city simultaneously investing unprecedented sums while grappling with finite resources. Every billion allocated to one corridor is unavailable for another. The data suggests London's infrastructure ambitions are real—and so are the tough choices ahead.
This article was compiled by AI and screened before publishing. See our editorial standards.
News
News
News
News
About this article
Published by The Daily London
Spread the word
Daily brief
Free, in your inbox before 7am. Weekdays.
Before you go
The day's London news in a 2-minute read. Free, weekday mornings.